Prometheus Dashboards Access
by Anish
Posted on Wednesday January 9, 2019
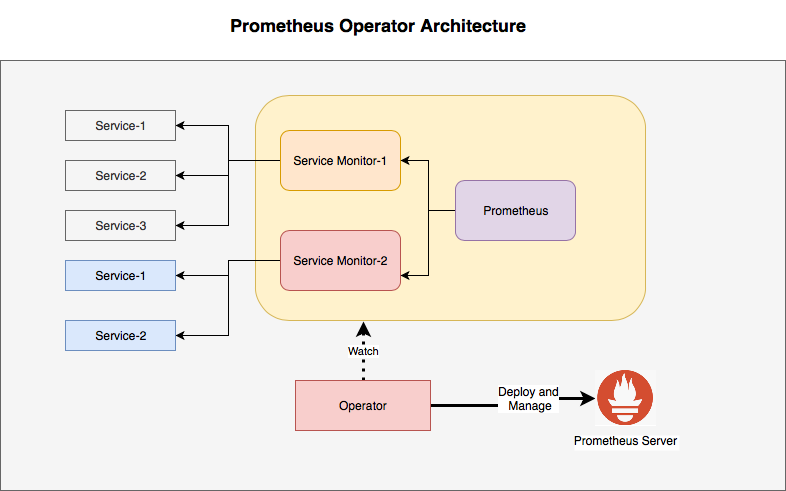
The default installation of prometheus comes with these three dashboards
- Prometheus-Operator UI
- AlertManager UI
- Grafana UI
Before Accessing the UI make sure you have all the prometheus necessary pods are up and running
root@kube-master:# kubectl --namespace monitoring get pods
NAME                                                     READY     STATUS    RESTARTS   AGE
alertmanager-prometheus-operator-alertmanager-0          2/2       Running   0          53m
prometheus-operator-grafana-7654f69d89-mxwwh             3/3       Running   0          53m
prometheus-operator-kube-state-metrics-cdf84dd85-fkdvs   1/1       Running   0          53m
prometheus-operator-operator-54f7767b66-rdh8c            1/1       Running   0          53m
prometheus-operator-prometheus-node-exporter-6ldmm       1/1       Running   0          53m
prometheus-operator-prometheus-node-exporter-9gtqt       1/1       Running   0          53m
prometheus-prometheus-operator-prometheus-0              3/3       Running   1          53m
Prometheus ports
These are the standard ports which will be helpful while dealing with Prometheus server and it’s associated service.
- 9090 - Prometheus server
- 9091 - Pushgateway
- 9092 - UNALLOCATED (to avoid collision with Kafka)
- 9093 - Alertmanager
- 9094 - Alertmanager clustering
To view the TargetPort under the prometheus namespace monitoring
root@kube-master:/home/ansible# kubectl describe svc -n  monitoring
Name:              alertmanager-operated
Namespace:         monitoring
Labels:            operated-alertmanager=true
Annotations:       <none>
Selector:          app=alertmanager
Type:              ClusterIP
IP:                None
Port:              web  9093/TCP
TargetPort:        9093/TCP
Endpoints:         10.244.1.102:9093
Port:              mesh  6783/TCP
TargetPort:        6783/TCP
Endpoints:         10.244.1.102:6783
Session Affinity:  None
Events:            <none>


Name:              prometheus-operated
Namespace:         monitoring
Labels:            operated-prometheus=true
Annotations:       <none>
Selector:          app=prometheus
Type:              ClusterIP
IP:                None
Port:              web  9090/TCP
TargetPort:        web/TCP
Endpoints:         10.244.1.103:9090
Session Affinity:  None
Events:            <none>


Name:              prometheus-operator-alertmanager
Namespace:         monitoring
Labels:            app=prometheus-operator-alertmanager
                   chart=prometheus-operator-1.5.2
                   heritage=Tiller
                   release=prometheus-operator
Annotations:       <none>
Selector:          alertmanager=prometheus-operator-alertmanager,app=alertmanager
Type:              ClusterIP
IP:                10.105.171.62
Port:              web  9093/TCP
TargetPort:        9093/TCP
Endpoints:         10.244.1.102:9093
Session Affinity:  None
Events:            <none>


Name:              prometheus-operator-grafana
Namespace:         monitoring
Labels:            app=grafana
                   chart=grafana-1.19.1
                   heritage=Tiller
                   release=prometheus-operator
Annotations:       <none>
Selector:          app=grafana,release=prometheus-operator
Type:              ClusterIP
IP:                10.111.200.84
Port:              service  80/TCP
TargetPort:        3000/TCP
Endpoints:         10.244.1.99:3000
Session Affinity:  None
Events:            <none>


Name:              prometheus-operator-kube-state-metrics
Namespace:         monitoring
Labels:            app=kube-state-metrics
                   chart=kube-state-metrics-0.12.1
                   heritage=Tiller
                   release=prometheus-operator
Annotations:       prometheus.io/scrape=true
Selector:          app=kube-state-metrics,release=prometheus-operator
Type:              ClusterIP
IP:                10.97.64.74
Port:              http  8080/TCP
TargetPort:        8080/TCP
Endpoints:         10.244.1.100:8080
Session Affinity:  None
Events:            <none>


Name:              prometheus-operator-operator
Namespace:         monitoring
Labels:            app=prometheus-operator-operator
                   chart=prometheus-operator-1.5.2
                   heritage=Tiller
                   release=prometheus-operator
Annotations:       <none>
Selector:          app=prometheus-operator-operator,release=prometheus-operator
Type:              ClusterIP
IP:                10.105.149.5
Port:              http  8080/TCP
TargetPort:        http/TCP
Endpoints:         10.244.1.101:8080
Session Affinity:  None
Events:            <none>


Name:              prometheus-operator-prometheus
Namespace:         monitoring
Labels:            app=prometheus-operator-prometheus
                   chart=prometheus-operator-1.5.2
                   heritage=Tiller
                   release=prometheus-operator
Annotations:       <none>
Selector:          app=prometheus,prometheus=prometheus-operator-prometheus
Type:              ClusterIP
IP:                10.105.66.183
Port:              web  9090/TCP
TargetPort:        web/TCP
Endpoints:         10.244.1.103:9090
Session Affinity:  None
Events:            <none>


Name:              prometheus-operator-prometheus-node-exporter
Namespace:         monitoring
Labels:            app=prometheus-node-exporter
                   chart=prometheus-node-exporter-1.1.0
                   heritage=Tiller
                   jobLabel=node-exporter
                   release=prometheus-operator
Annotations:       prometheus.io/scrape=true
Selector:          app=prometheus-node-exporter,release=prometheus-operator
Type:              ClusterIP
IP:                10.108.197.197
Port:              metrics  9100/TCP
TargetPort:        9100/TCP
Endpoints:         172.16.2.13:9100,172.16.2.7:9100
Session Affinity:  None
Events:            <none>
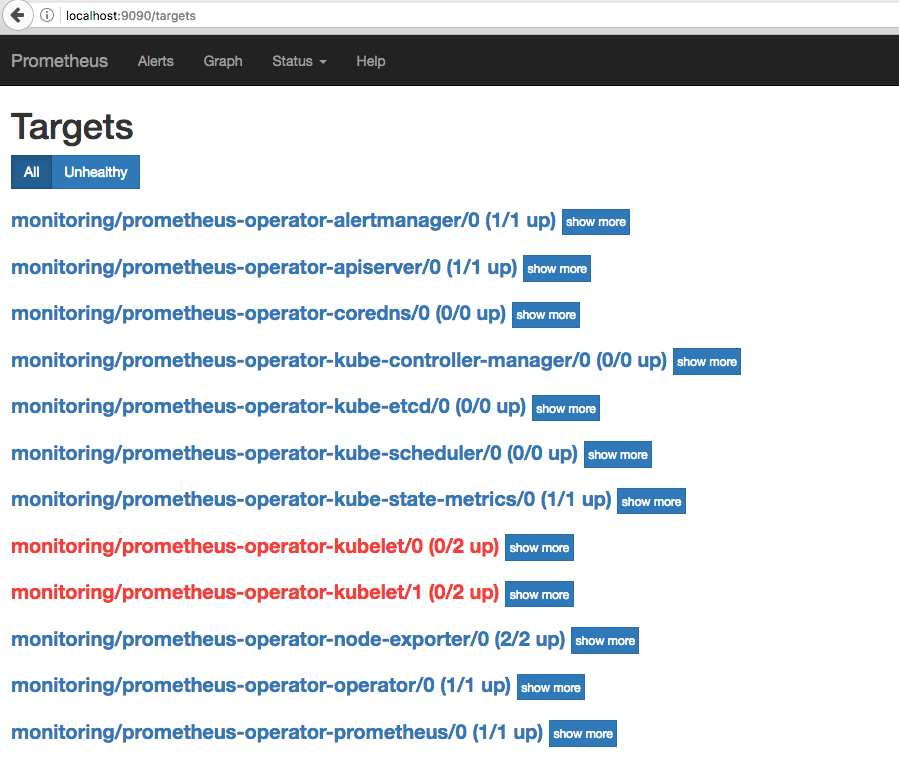
Prometheus-Operator UI
kubectl port-forward -n monitoring prometheus-prometheus-operator-prometheus-0 9090
Open web browser to http://localhost:9090 , you will access the Prometheus interface.
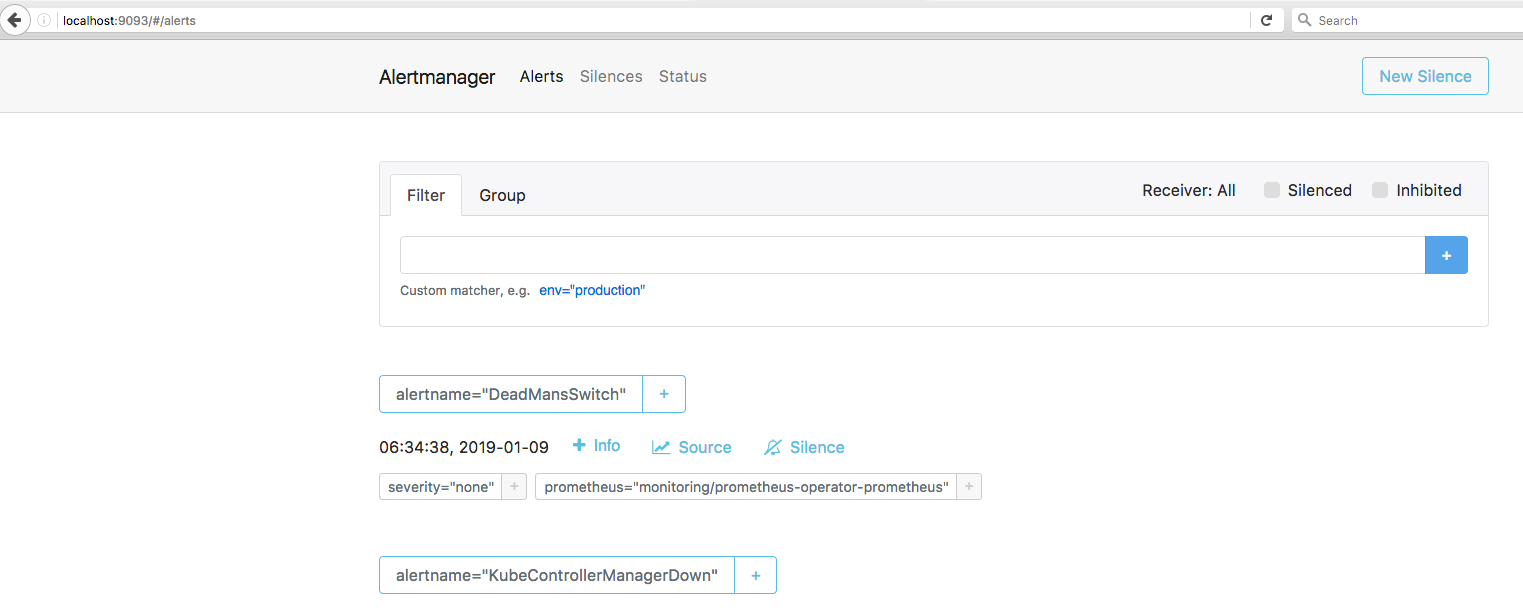
Prometheus Alert-Manager UI
kubectl port-forward -n monitoring alertmanager-prometheus-operator-alertmanager-0 9090:9093
Open web browser to http://localhost:9093 , you will access the Prometheus interface.
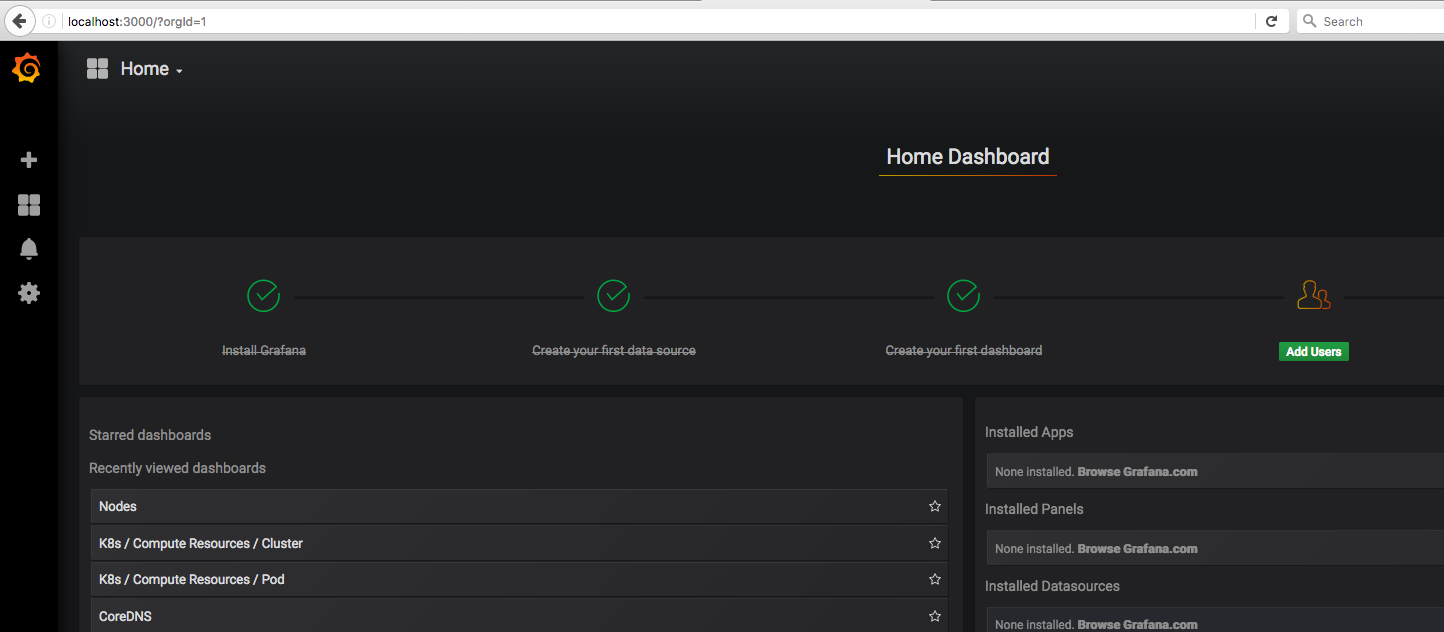
Prometheus Grafana UI
kubectl port-forward -n monitoring prometheus-operator-grafana-7654f69d89-mxwwh 3000:3000
UI Credentials are admin:admin or admin:promo-operator
Further Reading
- Checkout how to deploy HTTPS Secure Nginx deploymet in kubernetes
Thanku for reading !!! Give a Share for Support
Your Support Matters!
Instead of directly asking for donations, I'm thrilled to offer you all nine of my books for just $9 on leanpub By grabbing this bundle you not only help cover my coffee, beer, and Amazon bills but also play a crucial role in advancing and refining this project. Your contribution is indispensable, and I'm genuinely grateful for your involvement in this journey!
Any private key value that you enter or we generate is not stored on this site, this tool is provided via an HTTPS URL to ensure that private keys cannot be stolen, for extra security run this software on your network, no cloud dependency
Kubernetes Related Topics
Linux Related Topics
Ansible Related Topics
Applied Cryptography Topics
Web Crypto API Topics
Openstack Articles
python Cryptography Topics
PHP Cryptography Topics
Topics
For Coffee/ Beer/ Amazon Bill and further development of the project Support by Purchasing, The Modern Cryptography CookBook for Just $9 Coupon Price
Kubernetes for DevOps
Hello Dockerfile